Click to Print
Patello-Femoral (Runner's Knee) 
Table List Visual List
The following list of shoes are suitable for your foot type. Those of heavier physical stature may find greater comfort and durability in their footwear if they choose from the next higher level of stability. Those with orthopedic injuries, please consult our Injury Profiler.
| Shoe |
Weight |
TCI |
VCI |
Vertical Support  |
Cushion |
SSI |
Level |
RI |
Recommendations |
|
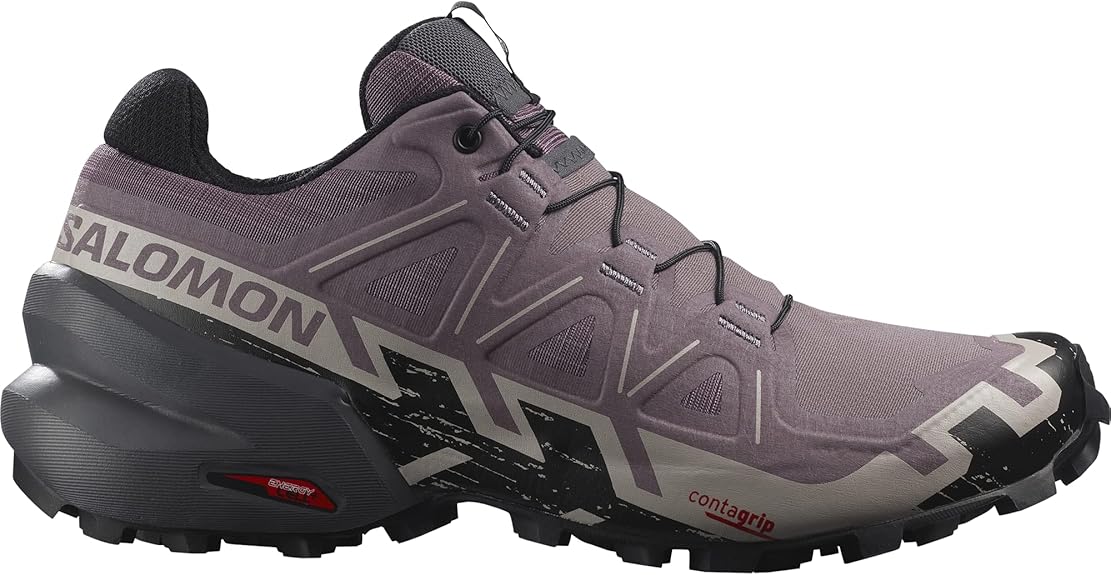
Salomon – SpeedCross 6 |
8.7 |
52.0 in.-lbs (High) |
5.09 mm (Mod) |
4.91 mm (Mod) |
Mod |
67.4 |
Moderate Stability |
High |
Supination, Moderate Pronation, Severe Pronation |
|
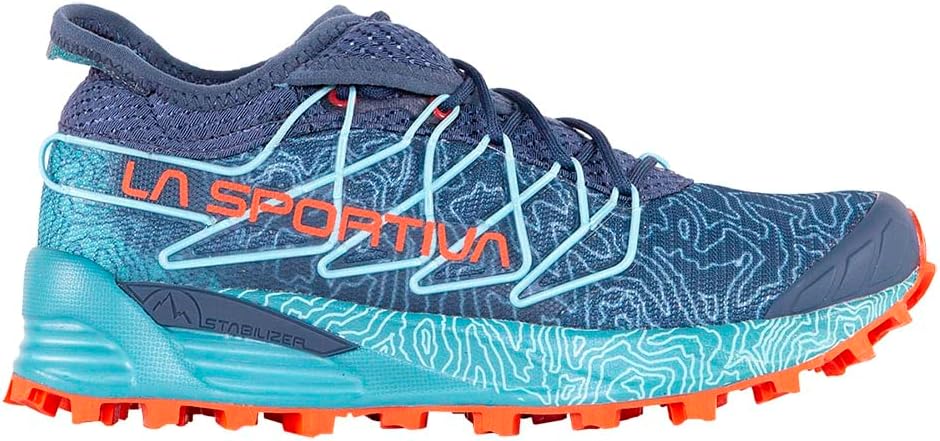
LaSportiva – Mutant |
9.7 |
47 in.-lbs (Mod) |
4.96 mm (Min) |
5.04 mm (Max) |
Soft |
64.9 |
Moderate Stability |
High |
Supination, Moderate Pronation |
|
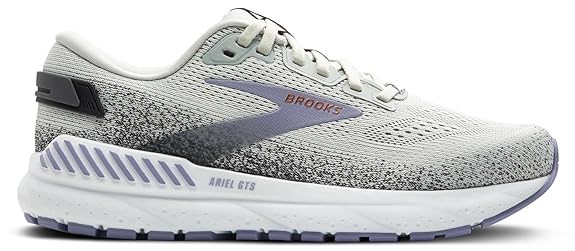
Brooks – Ariel 24 |
9 |
45.0 in.-lbs (Mod) |
6.10 mm (Min) |
5.9 mm (Max) |
Soft |
56.0 |
Minimum Stability |
High |
Supination, Neutral Pronation, Mild Pronation, Moderate Pronation, Flat Feet |
|
New Balance – 1540v3 |
11.4 |
68.0 in.-lbs (High) |
3.86 mm (Max) |
6.14 mm (Max) |
Firm |
86.3 |
High Stability |
Medium |
Supination, Moderate Pronation, Severe Pronation, Flat Feet |
|
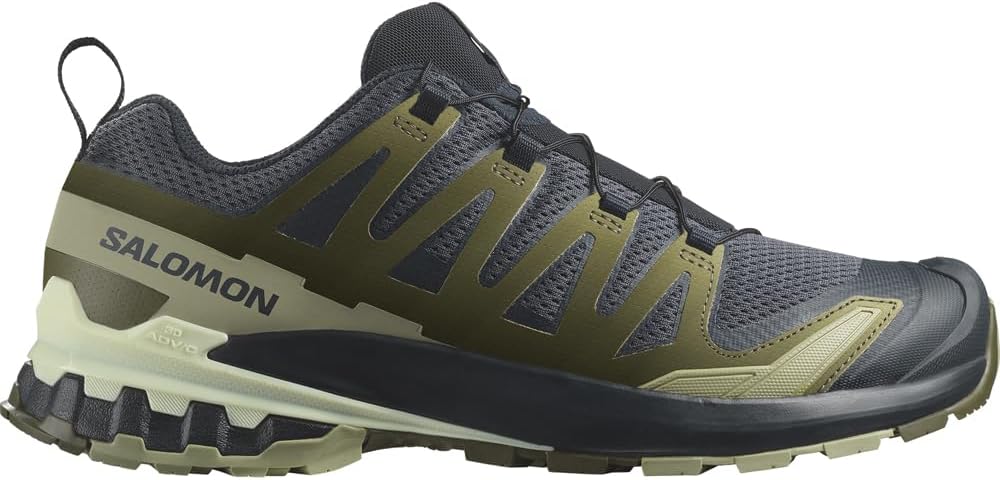
Salomon – Xa Pro 3D v9 |
10.2 |
60.0 in.-lbs (High) |
4.97 mm (Mod) |
6.03 mm (Max) |
Mod |
73.5 |
High Stability |
High |
Supination, Moderate Pronation, Severe Pronation |
|
Brooks – Addiction 15 |
9.3 |
60.0 in.-lbs (High) |
5.07 mm (Mod) |
6.93 mm (Max) |
Mod |
72.9 |
High Stability |
High |
Supination, Moderate Pronation, Severe Pronation, Flat Feet |
SpeedCross 6
Salomon / / 8.7
| Overall Stability |
SSI: 67.4 (Moderate Stability) |
| Midfoot Stability |
TCI: 52.0 in.-lbs (High) |
| Hindfoot Stability |
VCI: 5.09 mm (Mod) |
| Loaded HTD (Vert Support): |
4.91 mm (Mod) |
| Cushioning: |
Mod |
| RI Index (Energy Return): |
23.47 mm (High) |
Achilles Tendonitis
Anterior Shin Splints
Hallux Valgus (Bunion)
Ilio-Tibial Band Syndrome
Lateral Ankle Sprain
Medial Shin Splints
Neuroma
Patello-Femoral (Runner's Knee)
Plantar Fasciitis
Posterior Tibial Tendonitis
Foot Pattern
Supination
Neutral Pronation
Mild Pronation
Moderate Pronation
Severe Pronation
Flat Feet
Mutant
LaSportiva / / 9.7
| Overall Stability |
SSI: 64.9 (Moderate Stability) |
| Midfoot Stability |
TCI: 47 in.-lbs (Mod) |
| Hindfoot Stability |
VCI: 4.96 mm (Min) |
| Loaded HTD (Vert Support): |
5.04 mm (Max) |
| Cushioning: |
Soft |
| RI Index (Energy Return): |
21.15 mm (High) |
Achilles Tendonitis
Anterior Shin Splints
Hallux Valgus (Bunion)
Ilio-Tibial Band Syndrome
Lateral Ankle Sprain
Medial Shin Splints
Neuroma
Patello-Femoral (Runner's Knee)
Plantar Fasciitis
Posterior Tibial Tendonitis
Foot Pattern
Supination
Neutral Pronation
Mild Pronation
Moderate Pronation
Severe Pronation
Flat Feet
| Overall Stability |
SSI: 56.0 (Minimum Stability) |
| Midfoot Stability |
TCI: 45.0 in.-lbs (Mod) |
| Hindfoot Stability |
VCI: 6.10 mm (Min) |
| Loaded HTD (Vert Support): |
5.9 mm (Max) |
| Cushioning: |
Soft |
| RI Index (Energy Return): |
26.01 mm (High) |
Achilles Tendonitis
Anterior Shin Splints
Hallux Valgus (Bunion)
Ilio-Tibial Band Syndrome
Lateral Ankle Sprain
Medial Shin Splints
Neuroma
Patello-Femoral (Runner's Knee)
Plantar Fasciitis
Posterior Tibial Tendonitis
Foot Pattern
Supination
Neutral Pronation
Mild Pronation
Moderate Pronation
Severe Pronation
Flat Feet
1540v3
New Balance / / 11.4
| Overall Stability |
SSI: 86.3 (High Stability) |
| Midfoot Stability |
TCI: 68.0 in.-lbs (High) |
| Hindfoot Stability |
VCI: 3.86 mm (Max) |
| Loaded HTD (Vert Support): |
6.14 mm (Max) |
| Cushioning: |
Firm |
| RI Index (Energy Return): |
14.78 mm (Medium) |
Achilles Tendonitis
Anterior Shin Splints
Hallux Valgus (Bunion)
Ilio-Tibial Band Syndrome
Lateral Ankle Sprain
Medial Shin Splints
Neuroma
Patello-Femoral (Runner's Knee)
Plantar Fasciitis
Posterior Tibial Tendonitis
Foot Pattern
Supination
Neutral Pronation
Mild Pronation
Moderate Pronation
Severe Pronation
Flat Feet
Xa Pro 3D v9
Salomon / / 10.2
| Overall Stability |
SSI: 73.5 (High Stability) |
| Midfoot Stability |
TCI: 60.0 in.-lbs (High) |
| Hindfoot Stability |
VCI: 4.97 mm (Mod) |
| Loaded HTD (Vert Support): |
6.03 mm (Max) |
| Cushioning: |
Mod |
| RI Index (Energy Return): |
23.50 mm (High) |
Achilles Tendonitis
Anterior Shin Splints
Hallux Valgus (Bunion)
Ilio-Tibial Band Syndrome
Lateral Ankle Sprain
Medial Shin Splints
Neuroma
Patello-Femoral (Runner's Knee)
Plantar Fasciitis
Posterior Tibial Tendonitis
Foot Pattern
Supination
Neutral Pronation
Mild Pronation
Moderate Pronation
Severe Pronation
Flat Feet
Addiction 15
Brooks / / 9.3
| Overall Stability |
SSI: 72.9 (High Stability) |
| Midfoot Stability |
TCI: 60.0 in.-lbs (High) |
| Hindfoot Stability |
VCI: 5.07 mm (Mod) |
| Loaded HTD (Vert Support): |
6.93 mm (Max) |
| Cushioning: |
Mod |
| RI Index (Energy Return): |
18.57 mm (High) |
Achilles Tendonitis
Anterior Shin Splints
Hallux Valgus (Bunion)
Ilio-Tibial Band Syndrome
Lateral Ankle Sprain
Medial Shin Splints
Neuroma
Patello-Femoral (Runner's Knee)
Plantar Fasciitis
Posterior Tibial Tendonitis
Foot Pattern
Supination
Neutral Pronation
Mild Pronation
Moderate Pronation
Severe Pronation
Flat Feet
Shoe Definitions

What is SSI?
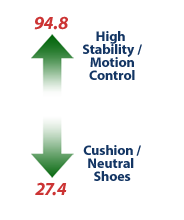
Shoe Stability Index (SSI) is an indicator of shoe stability, as an index. SSI is derived through mathematically combining the quantified measurements of midfoot stability (TCI) and hindfoot stability (VCI), indicating the shoe’s overall ability to control the motion of the foot.

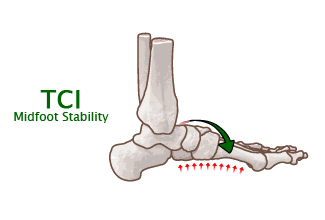
What is TCI?
Torsion Control Index (TCI) is a measurement of midfoot shoe stability, in inch-pound units (in.-lbs.). TCI is measured through actively twisting a shoe around the longitudinal axis of the shoe, from the heel to the area of the toes joints, simulating rotational forces of the foot, and measuring the shoe’s resistance to this motion.
The higher the TCI, the firmer the midfoot and more torsional stability. The lower the TCI, the softer the midfoot and less torsional stability.
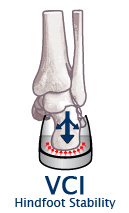
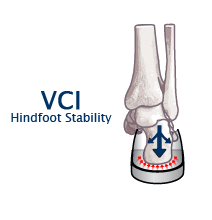
What is VCI?
Vertical Compression Index (VCI) is a measurement of hindfoot shoe stability, in millimeters (mm). VCI is measured through compression of the heel portion of the shoe under a fixed amount of pressure, thereby measuring how the structure of the shoe controls rearfoot motion.
The higher the VCI, the softer the midsole and less hindfoot stability. The lower the VCI, the firmer the midsole and more hindfoot stability.

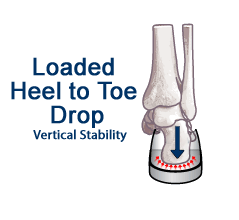
What is Loaded Heel to Toe Drop?
Loaded Heel to Toe Drop is the measurement in millimeters of the height of the heel relative to the fore foot when compressed to a fixed poundage. This can be defined as vertical support.
What is RI?
Rebound Index (RI) is an indicator of energy return of shoe to the foot, in millimeters (mm). RI is measured through compression of the heel portion of the shoe under a fixed amount of pressure, and then determining how much force the shoe exerts on the foot.
What is Fore Flex?
Fore Flex is the measurement in millimeters of the fore foot when compressed to a fixed poundage. The higher the Fore Flex, the softer the sole, allowing more bend at the fore foot. The lower the Fore Flex, the firmer the sole, allowing less bend at the fore foot.
Determining Foot Pattern
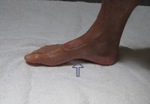
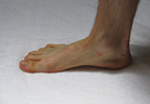
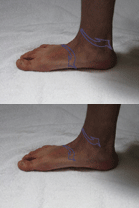
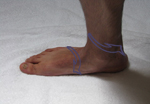
Compare your feet and water footprints to the images seen above. All pictures were taken in a weight bearing position (standing). Once again, these images should only be used as a casual guide until you can be evaluated properly.
The most accurate way to determine your foot pattern is to have a professional observe you walking barefoot. A doctor, physical therapist or a specialty running store should be able to do this for you. Although not perfect, the “water” test can also give you some idea of your foot type. This entails getting your feet wet, walking on dry cement, and observing the prints left behind (see images above).
Please remember that foot patterns are defined by the motion of the foot (or lack thereof) through the gait cycle, and not solely the height of the arch. Although the type of heel strike can often be determined by the wear of a shoe, shoe wear does not always indicate the actual foot pattern (which occurs in the mid-stance of the gait cycle, after heel strike).


